|
Temperature Ensite |
|
9 views
|
| About ICSE Materials | |
Classroom materials for STEM |

|
 Copyright/Creative Commons Materials are published under the CC BY-NC-SA 4.0 license.   
|
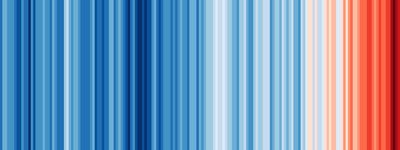
Abstract Students explore data and data-representations on global temperature 'anomalies' (differences with respect to long-time average) on different websites. Students study and analyse the data set as well as the representations of it. They also need to think about how the 'raw' data have been collected and summarized into the available datasets to make these visualisations. Each small group makes a short presentation on global temperature change, using information from the websites given. Task Investigate three websites
As a small group, make a short presentation on global temperature, based on the representations on one or more of these sites. Documents Three websites for the research
Other resources |
Discipline - Mathematics ✓ - Biology - Physics - Chemistry - Engineering Target group - Primary Education - Lower Secondary Education ✓ - Upper Secondary Education Age range 11-15 Duration 50 min. Source |