In this manual we show how to derive data from two countries (Finland and the Netherlands) from the website
data.footprintnetwork.org to compare two variables:
- Ecological footprint per person (EFConsPerCap)
- Biocapacity per person (BiocapPerCap)
The data and a simple question
World
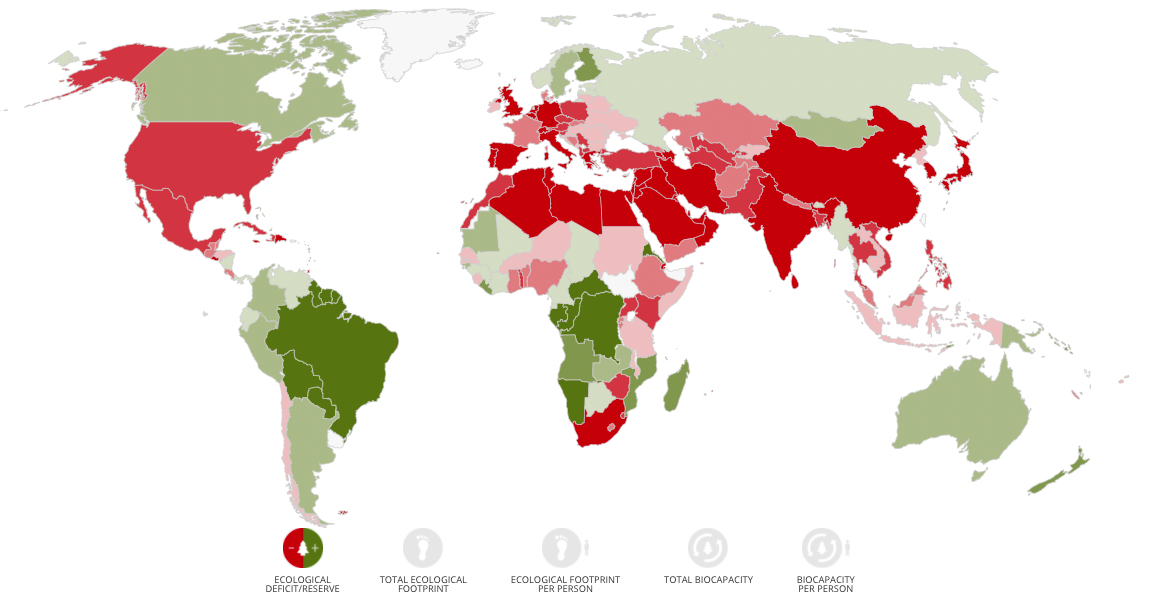
We take a green country (Finland) and a red country (Netherlands). |
Finland
Click on Finland and you get this: 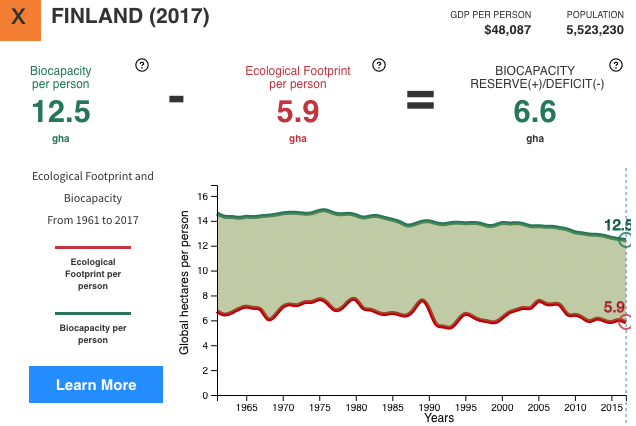
|
Netherlands
Click on the Netherlands and you get this: 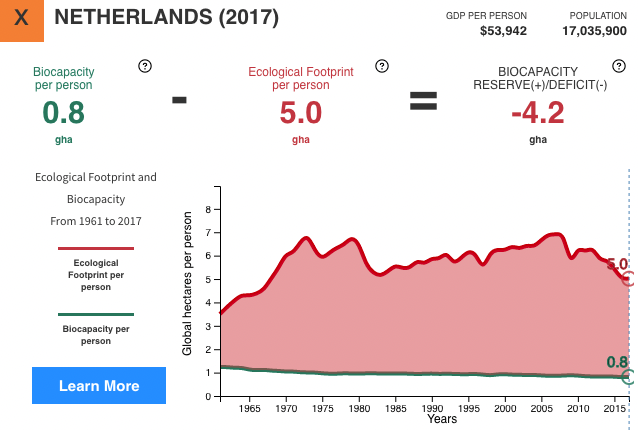
|
You can click on all images to have a larger view.
Of course you can go to data.footprintnetwork.org/#/ to have the interactive website.
The question is: how to get the four line graphs (two from Finland; two from the Netherlands) in one graph.
Steps to find the answer
We work in Excel.
| 1 |
Download the data
Database in excel format derived from data.footprintnetwork.org (1961 - 2017) Have a close look at the data. We will concentrate on the two variables:
|
| 2 |
Two separate files
- Make two separate excel files for Finland (code 67) and the Netherlands (code 150). - Just take out (copy) all rows with the correct country code (from the excel file with all countries) and save to the separate file(s). - Be careful to also copy the first row (with the column names). - Sort the data by 'record' (that's the column with the variable names). Now all data from EFConsPerCap and BiocapPerCap can be copied easily. |
| 3 |
One new file to join and make the graph
- Make a new excel file where you will join the data of the two countries, like this: 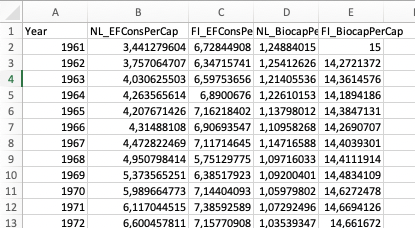
|
| 4 |
- Now you can make a graph of the four columns
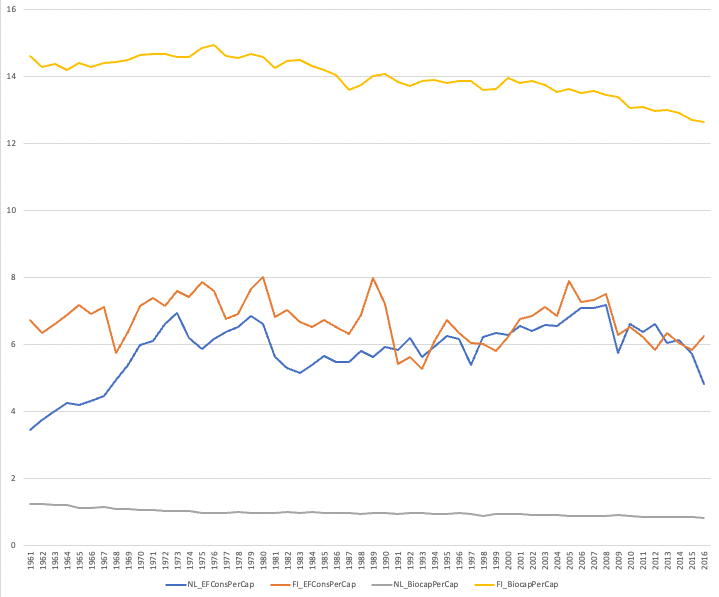
|
- You can compare with the graphs from the website.
|
|